Your reports
Read your Overview
The number tiles, the chart, date ranges and comparisons.
On this page
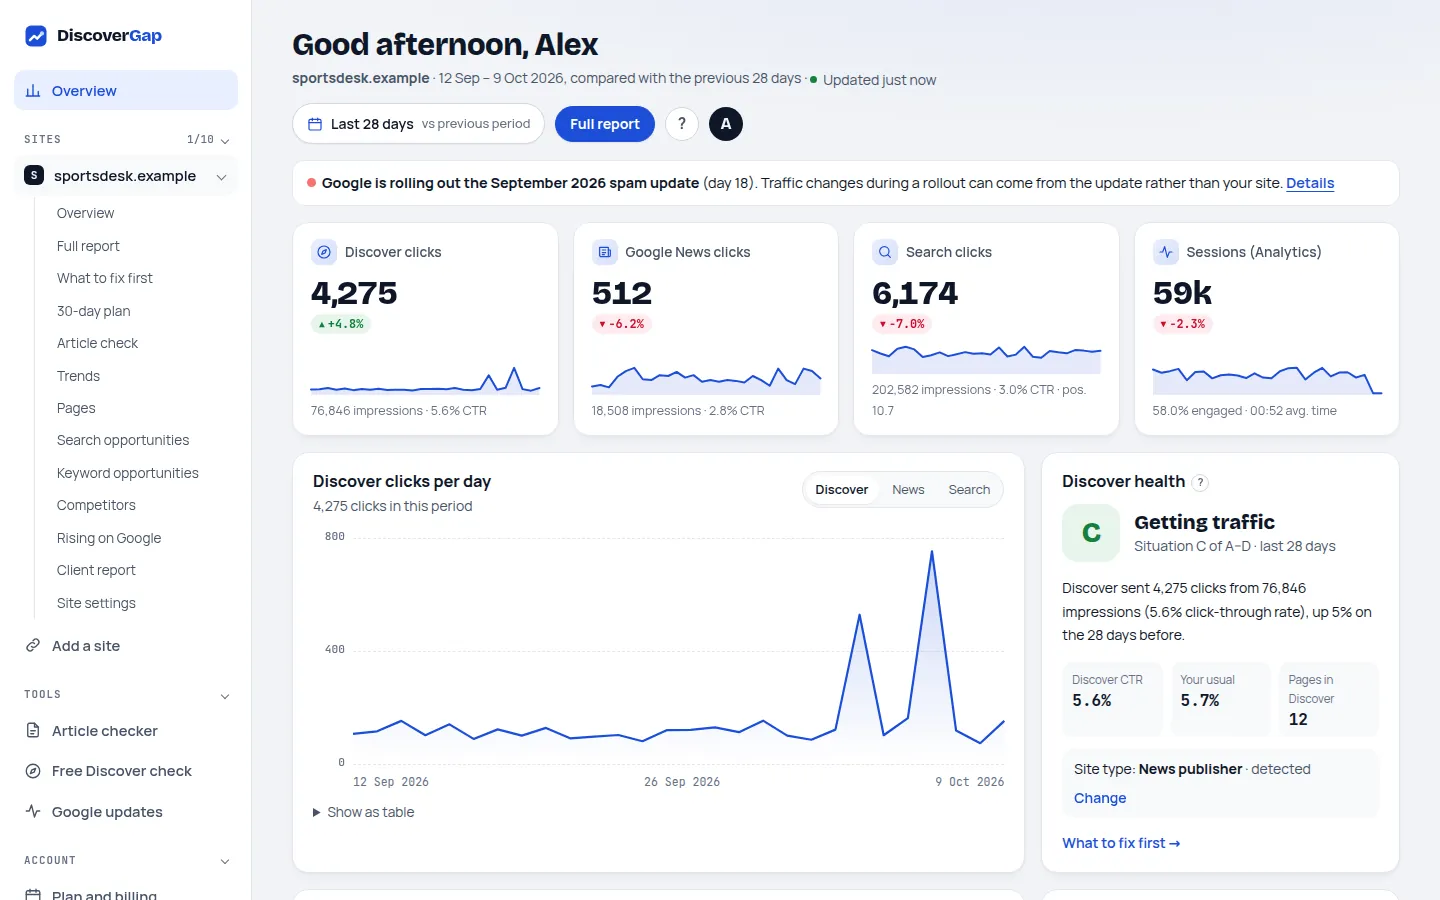
The Overview is your home page in DiscoverGap: the main figures for one site, how they're changing, and what to do this week.
Start here: the Today card
The card at the top answers two questions. The big line says what is happening with your Discover traffic right now, in plain words. If your last 2 weeks are outside your normal range, it says so and points to Why Discover changed.
Next to it, Worth doing next lists up to three things: tasks from this week's plan, articles to revisit, a setting to fix, or for agencies, the client report. The order follows the goal you picked when you started.
The number tiles
The tiles show clicks from Discover, Google News and Search for the dates you chose, plus visits from Google Analytics if you connected it. Under each number:
- The change chip compares with your comparison period: green is up, red is down. If there are no figures for the whole comparison period, it says so instead of guessing.
- The small line shows the shape of the period day by day.
- Shown is how often Google showed your pages (impressions). Clicked is the share of those that were clicked (click-through rate, or CTR).
Point at a large number to see the exact figure.
Choose your dates
- Click the date buttonAt the top right, it shows the current range, for example Last 28 days.
- Pick a rangeLast 7 days, 28 days, 3, 6 or 12 months, or 16 months (all the history Search Console keeps). Or enter your own From and To dates.
- Pick a comparisonPrevious period (the same number of days just before), Same period last year, or No comparison. Click Apply.
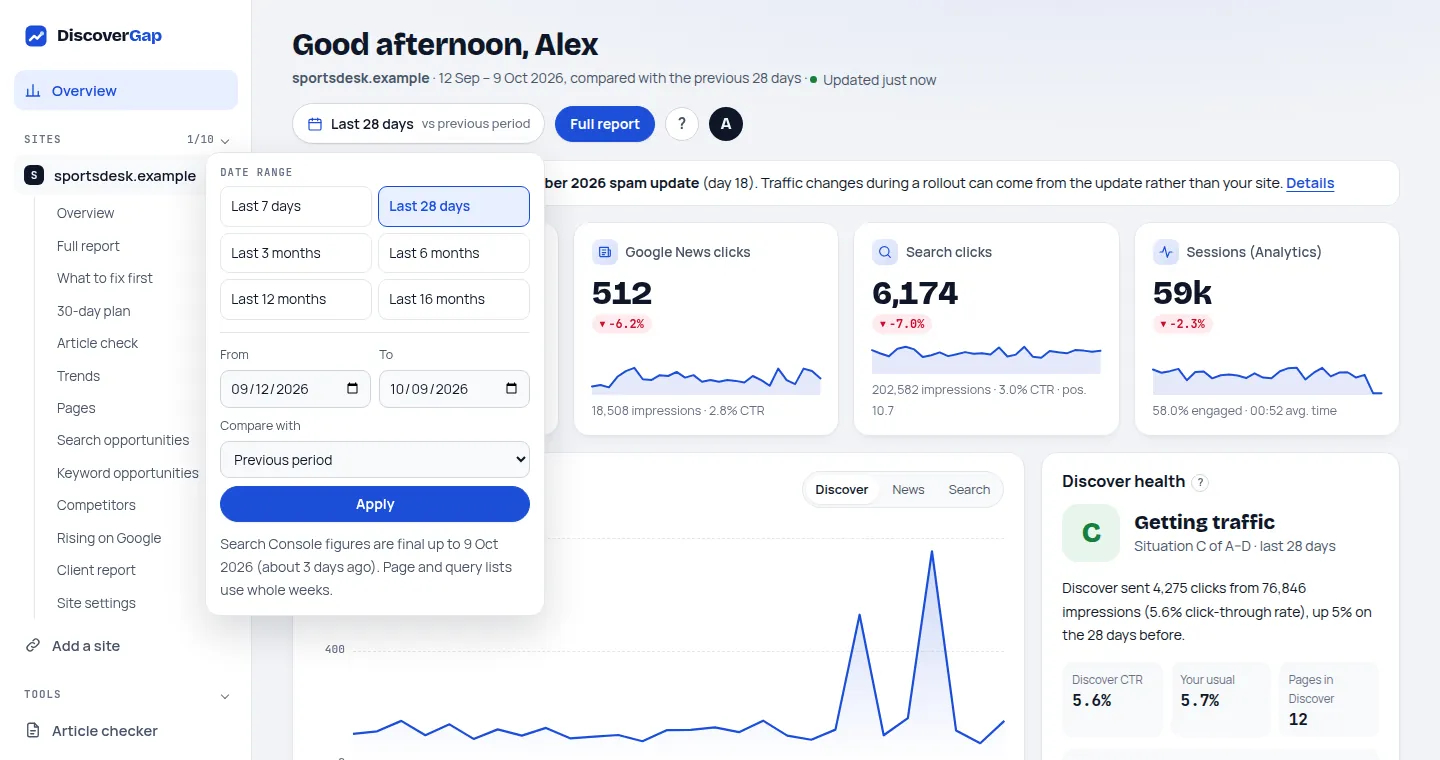
Your choice is remembered while you move around your account. The newest day is usually about 3 days ago, because we only use Search Console's final figures. Why.
The chart
Switch between Discover, News and Search above the chart. Point at or tap a day to see its clicks. Ranges longer than 4 months are shown week by week so the chart stays readable.
Your Discover status
The status card shows your Discover status, A to D, with the reason in plain words. It always uses the last 28 days, whatever dates you chose, because the rules are defined on that window.
This week and what to write next
The plan card shows the current week of your 30-day plan. Tick tasks as you finish them. Next to it you'll see either keyword opportunities (blogs) or what's rising on Google (news sites), whichever suits your site type more.
More for this site
Competitors, the article check, quick wins in Search, keyword ideas and your plan usage sit under More for this site near the bottom. Click it to open them. They're all in the full report too.
More than one site
With several sites, the Overview starts with an All sites table for the same dates. Click a site's name, or use the switcher at the top, to open it.
Last updated 24 October 2026